


Shanghai Gold Exchange Physical Delivery = Chinese Demand
 18 Sept 2013 22:01
 Koos Jansen
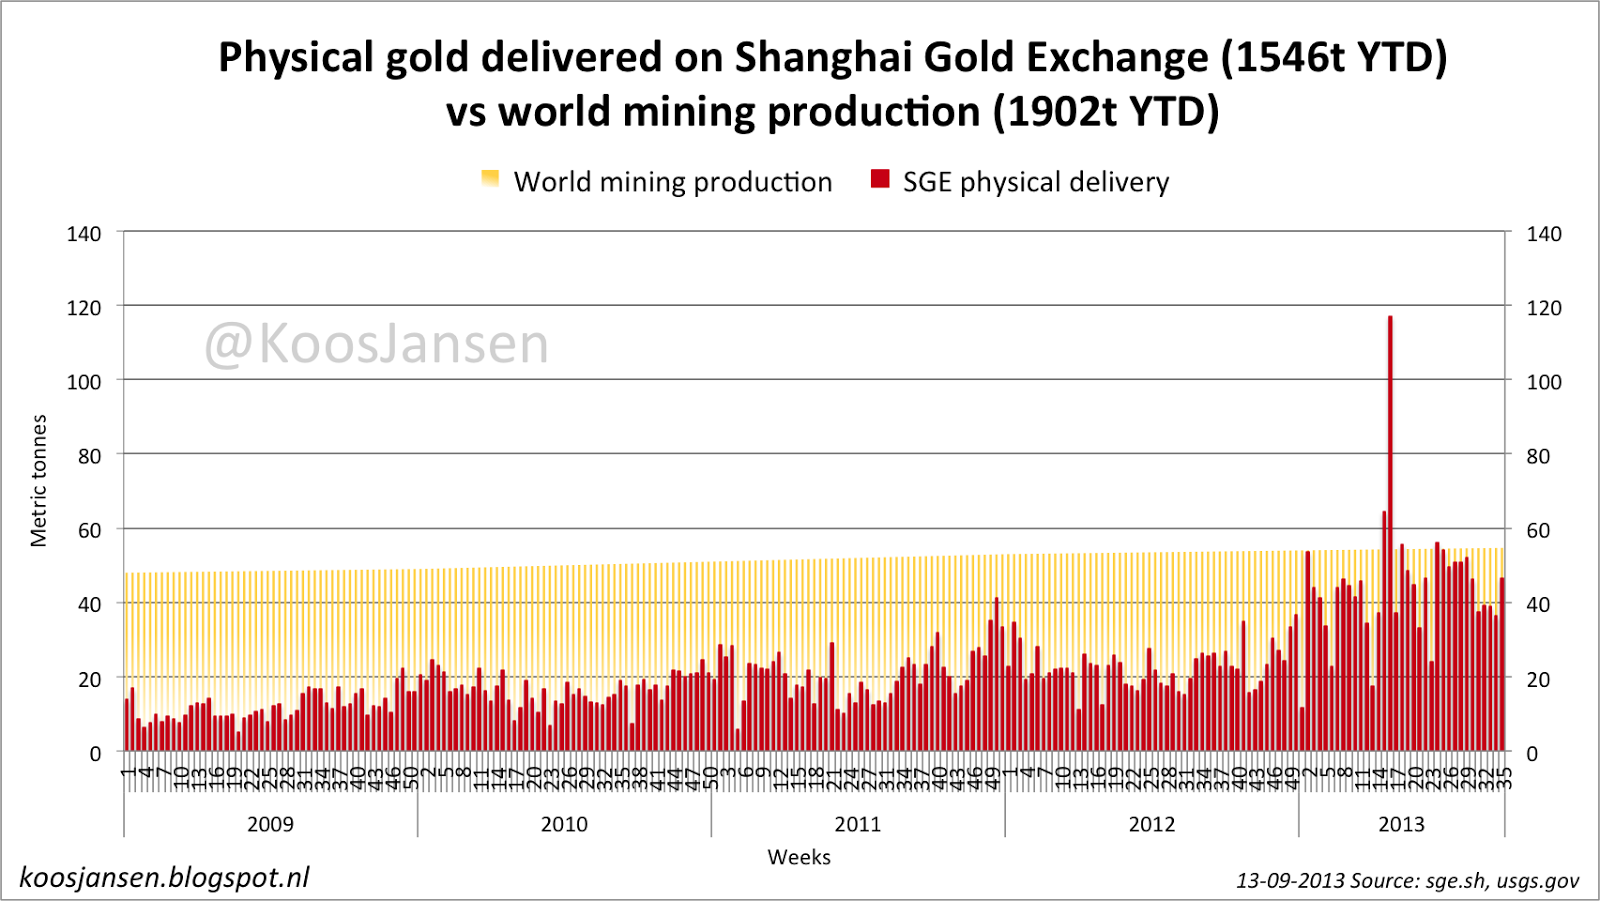
Year to date physical delivery on the Shanghai Gold Exchange stands at 1546 tons. Apart from an article on Bloomberg there has been little coverage in the mainstream media on this extreme amount of physical gold that is being sold in China, nor do they report on unusual high gold export from the UK to Switzerland, nor on equally remarkable export from Switzerland to China. They seem blind for the current shift in wealth and power that is taking place right in front of their eyes; for the distribution of gold to the east.
Commentators must wonder if the numbers the Shanghai Gold Exchange publishes regarding deliveries are truly about physical gold that leaves the SGE vaults. And if so, their relation to Chinese demand. In a previous post on this blog l’ve already shown that the delivery numbers I publish are about gold that is being withdrawn from one of the 49 designated warehouses in the mainland. Now we just have to connect a few dots to put this in perspective.
Chinese Demand
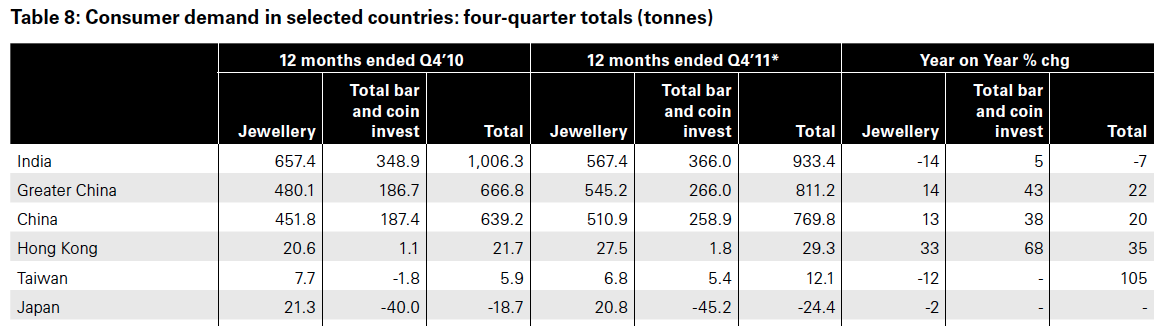
First let’s take a look at total Chinese gold demand, that is jewelry, industrial and investment demand (bars and coins) summed up. Oddly there is a difference between the data from the World Gold Council and the Peoples Bank Of China. Oncoming quote is from a Reuters article in which they report on 2011 total Chinese gold demand, their source is the WGC.
“We were still some distance away from the possibility that China might be the larger market in annual demand terms. What we’re doing, based on those figures for last year, is sticking our neck out a bit and suggesting that 2012 will be the first year that China does exceed India in terms of tonnage demand," WGC managing director, investment, Marcus Grubb said.
Total demand for gold in China in 2011 rose 20 percent to 769.8 tons, driven by jewelry and investment demand.
770 tons is much lower than what the PBOC reports. Every year there is a little known document published called the China Gold Market Report, compiled by the PBOC (and by the SGE, Shanghai Futures Exchange and China Gold Association, but these are all controlled by the PBOC).
 |
| A screen dump from the China Gold Market Report |
The annual report states Chinese gold demand is divided into six categories:
1. Jewelry manufacturing ..starting from 2003, China‘s gold use in the jewelry industry has been growing for 9 consecutive years, reaching 456.66 tons in 2011..
2. Industrial raw materials ..gold used in 2011 amounted to 53.22 tons, up 5.94 tons or 12.53 percent over the previous year.
3. Gold coin casting In 2011, the China Gold Coin Corporation planned to issue 1.486166 million gold coins in 15 categories, while the actual gold used reached 21.55 tons..
4. Investment gold bars for hoarding purposes In 2011, 213.85 tons of mini-sized gold bars were sold for hoarding purpose..
5. Other industrial purposes Throughout 2011, gold used for other purposes amounted to 13.52 tons..
6. Net investment Gold used for net investment refers to the demand arising from the transfer process of gold as an investment tool, which amounted to 284.88 tons in 2011..
The conclusion in the report (straight from the PBOC!):
Deregulation of the gold control to open the gold market to the public in 2002 led to the constant rise in Chinas gold demand, which unprecedentedly exceeded 1,000 tons in 2011..
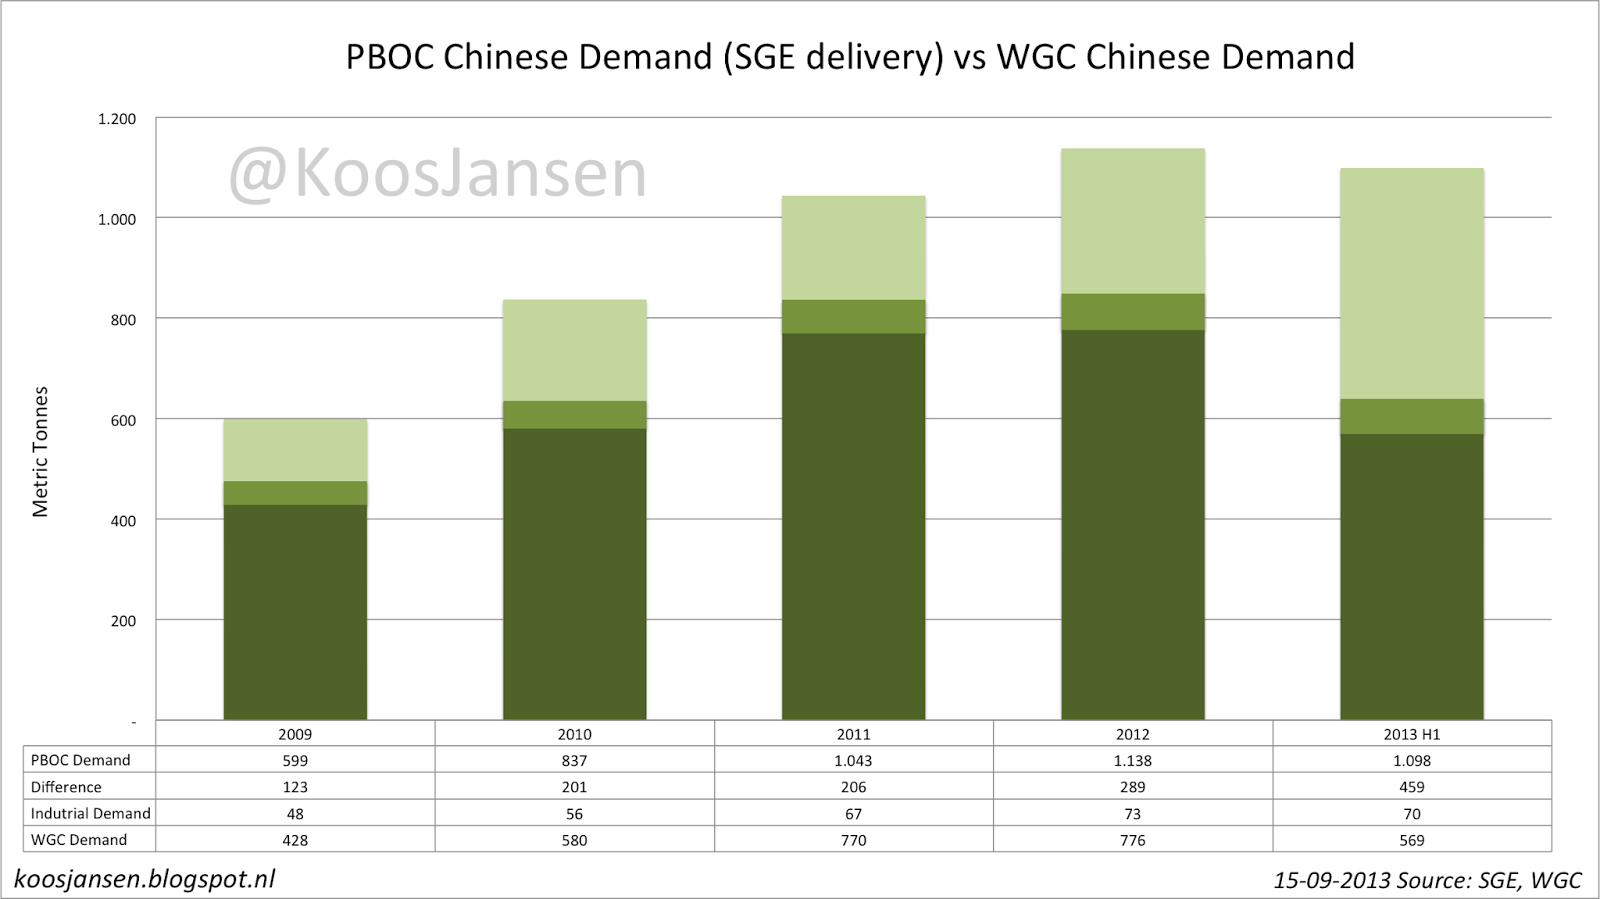
Although the WGC claims demand was 770 tons, it was actually more than 1000 tons. If we add up all six categories the outcome is 1043.68 tons, which indeed exceeds 1000 tons. Worth mentioning is that the PBOC not only controls the SGE , but also the commercial banks (that do a lot of trading for their clients on the SGE) and all gold mines. This supports the presumption that the PBOC has a clear view on Chinese demand.
SGE Delivery
The Chinese gold market is constructed by the PBOC such that by law all gold supply (import and mine) is required to be sold through the SGE. Once sold this gold is not aloud to return to the vaults of the SGE. Below a quote on legislation from the PBOC (link page 15):
On October 30, 2002, the Shanghai Gold Exchange commenced operation under the supervision of the State Council. Thereafter, the PBOC ceased its gold allocation and gold purchase operations. All PRC gold producers are now required to sell their standard gold bullion through the Shanghai Gold Exchange, and prices of gold on the Shanghai Gold Exchange are determined by market demand and supply, which essentially converge with the price of gold in the international market. On February 27, 2003, the State Council cancelled the approval requirements for the production and sale of gold and gold products. As a result, although the Administrative Regulations have not been abolished, the policy of “centralized purchase and allocation of gold” as stipulated under the Administrative Regulations has been terminated in practice.
Since July 2004, the State Council reformed the administrative approval system and cleared the outstanding projects which were subject to administrative approval by its ministries and departments. However, the import and export of gold and gold products remain subject to administrative examination and approval. The authority responsible for such examination and approval is the PBOC.
Read point 2 of a considerations segment from an ICBC gold product.
This rule does not mean investors can‘t sell their gold back to the ICBC, as we can see from ICBC’s Gold Repo program.
Now let’s take a look at SGE physical delivery. In the the screen dump below, taken from the last monthly SGE report in 2011, the second number from the right (which says 本年累计交割量) is total delivery in Kg.
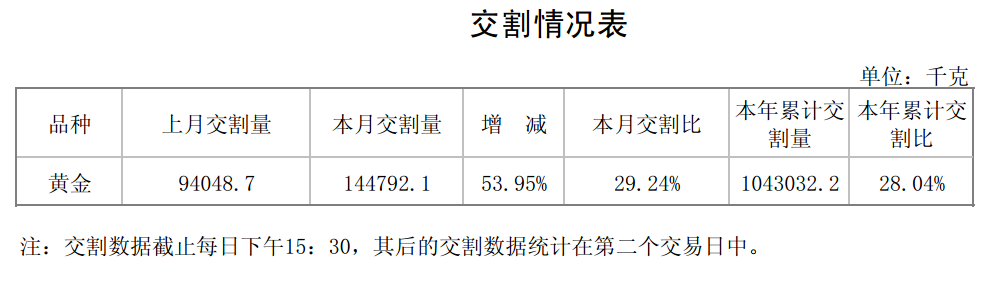
1043 tons, where have we seen this number before? That‘s right, it’s exactly total demand. Coincidence? I think not, but let’s double check with the numbers from 2010. From the China Gold Market Report 2010 we learn:
1. Jewelry manufacturing 357.12 tons
2. Industrial raw materials 47.38 tons
3. Gold coin casting 8.52 tons
4. Investment gold bars for hoarding purposes 141.88 tons
5. Other industrial purposes 16.61 tons
6. Net investment 265.7 tons
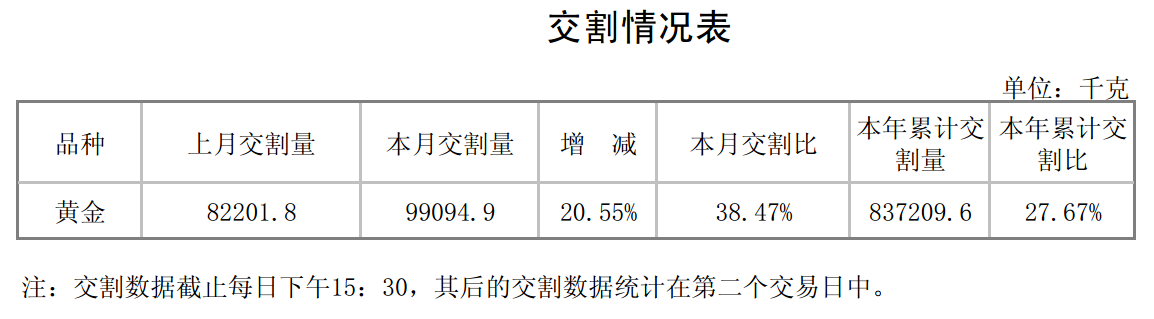
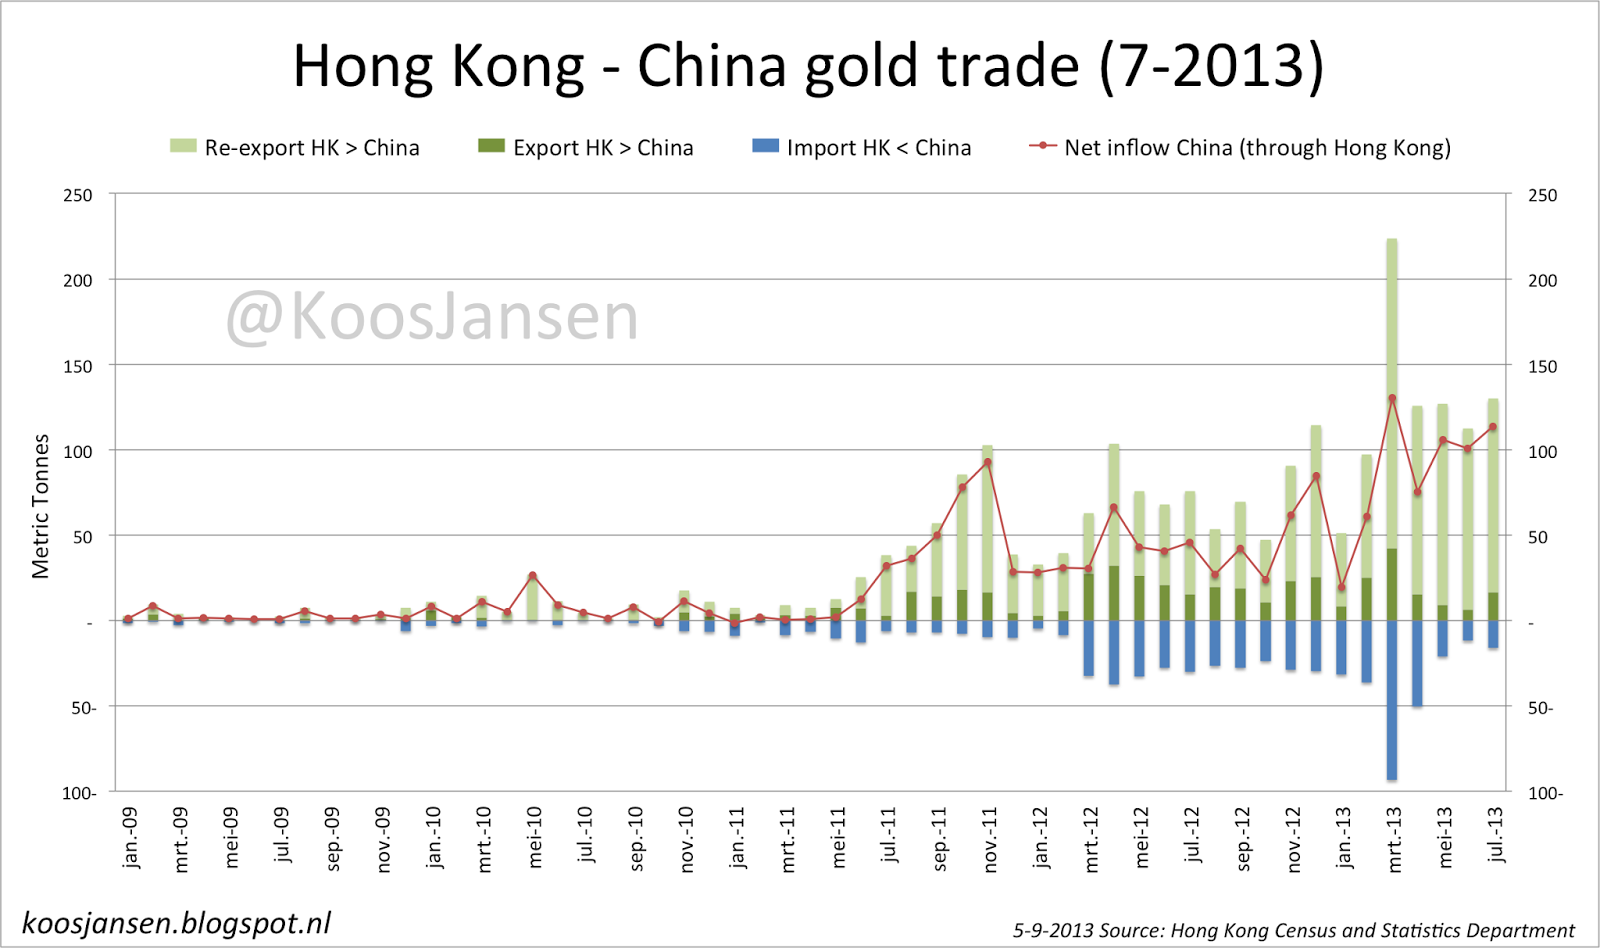
Exactly 837.21 tons, confirming that SGE physical delivery equals Chinese demand. Let this sink in for a minute. Although the price of gold has come down sharply in recent months and the west is getting more bearish by the day, year to date SGE physical delivery on 17 September 2013 stood at 1546 tons, heading for +2000 tons in total this year. This is more gold than the sovereign reserves of India, Japan, the UK and Saudi Arabia combined. At this very moment above ground gold is being moved on a massive scale, in the first seven months of this year 1018 tons were exported by the UK – out of GLD and the LBMA, most of this gold is refined by the Swiss into kilo bars and then sent to China.

The difference between WGC and PBOC data on Chinese demand
The WGC reports on gold demand from Greater China and from the separate regions China (mainland), Hong Kong and Taiwan.
The data that we publish in Gold Demand Trends are collected for us by Thomson Reuters GFMS. Our data represent jewelry and bar & coin demand and do not incorporate any industrial demand or fabrication, which is included in the PBoC figures. As I am sure you will appreciate, data collection of this sort relies on a number of proprietary sources and these will not necessarily be the same for both GFMS and PBOC. It is, therefore, perhaps not surprising that the estimates of demand differ somewhat. Without a greater level of transparency as to the nature of the PBOC data and their collection method, I am unable to comment in more detail on the reasons for the differences.
Thomson Reuters:
We have checked with our Data Specialist and confirmed that we use a different methodology. Total Chinese demand used by Thomson Reuters GFMS only include jewelry, physical bullion bars/coins and all industrial demand. Any stock movement change (which is essentially the item 6 net investment) will not be included as underlying demand. If you will add items 1-5 by the SGE report and then compare the total with our demand, we have a higher number.
Me:
So according to you category six is “stock movement change"? This would be gold added to the stocks from jewelers, the mint, industrial companies, etc? (this is a few hundred tons each year!)
Thomson Reuters:
That’s correct based on the resolution provided by our data specialist.
From the beginning of 2009 to the first half of 2013 “category six" in total was 1279 tons of gold. A stock pile this size is absolutely inexplicable for jewelers and the mint to hold.
Redistributing the chips
Popular Blog Posts by Koos Jansen
 China’s Secret Gold Supplier is Singapore
 Audits of U.S. Monetary Gold Severely Lack Credibility
 China Gold Import Jan-Sep 797t. Who’s Supplying?
 The Gold-Backed-Oil-Yuan Futures Contract Myth
 Estimated Chinese Gold Reserves Surpass 20,000t
 PBOC Gold Purchases: Separating Facts from Speculation
 U.S. Mint Releases New Fort Knox Audit Documentation
 China Net Imported 1,300t of Gold in 2016
 Why SGE Withdrawals Equal Chinese Gold Demand and Why Not


